
How to read financial statemements

Welcome to Reading Financial Statements 101. We have great news for you!
You do not have to be an expert to read financial statements, nor do you have to be from the industry to use them for your benefit. However, if you want to be Warren Buffet or Charlie Munger, analysing financial statements for decades (maybe centuries? Shhh) could put you at an advantage. Let’s explore what they are and how to read them.

What are Financial Statements?
Financial Statements are reports that summarise a company’s financial activities and performance. Accountants typically prepare these quarterly and annually to keep track of a company’s performance throughout.Analysts look at three main types of financial statements: the Income Statement, Balance Sheet and Cash Flow Statement. Each one has a different purpose, and they are most popularly presented in Annual Reports, which give insight into a company’s operations and financial standing yearly.
What is Their Purpose?
Investors and lenders use financial statements to measure a business’s performance, financial health, and earnings potential. All these factors are essential as investors and lenders look to earn from their investments or loans respectively. Financial statements provide a snapshot of a company’s revenues, expenses, profitability, cash, asset, and debt holding and assist in capital budgeting and investment decisions.Types of Financial Statements:
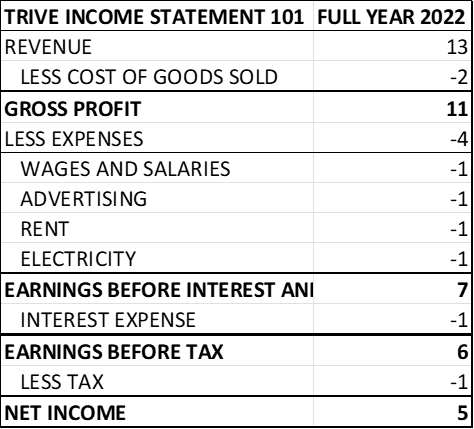
There are three main types of financial statements which we will explore below:- Income Statement
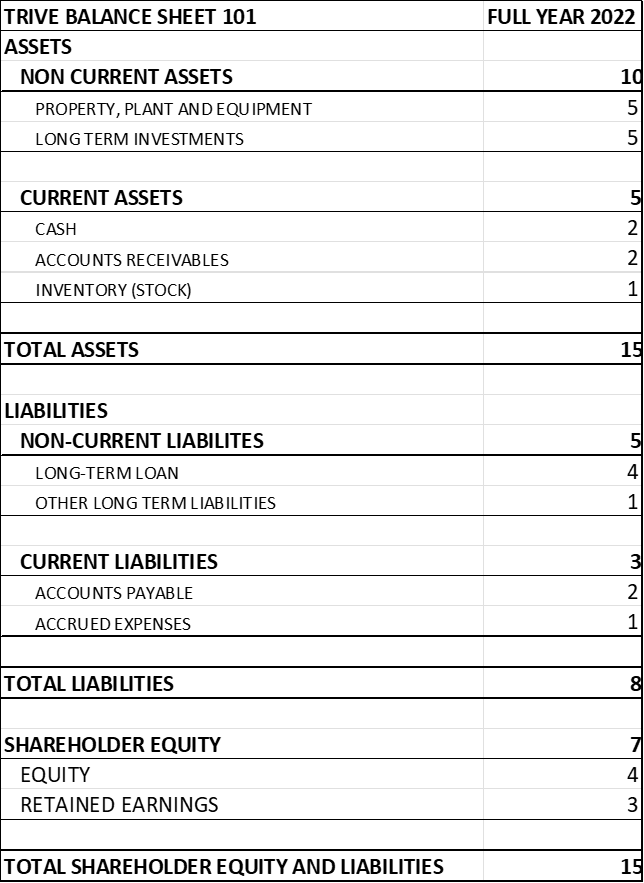
- Balance Sheet
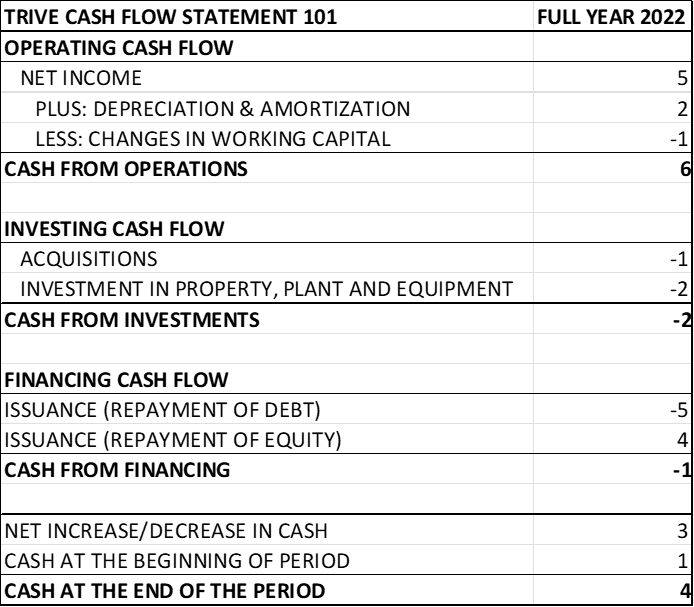
- Cash Flow Statement
Analysing Financial Statements
Reading financial statements is all about comparative analysis. It could be comparing one year to the next or of individual line items to another line item in the financial statements.- Vertical Analysis
- Horizontal Analysis
What To Look For
Generally, good companies are able to generate sales growth and bolster their net income year-over-year. The income statement can assist in determining whether a company is profitable or not. In addition, high levels of borrowing tend to affect a company’s income as it leads to higher interest expenses. Therefore, debt and equity ratios can determine the health of a company’s capital structure. Lastly, cash flows are required to keep the company’s lights on. If a company cannot generate cash, there surely is a problem.

Comments
No comments
Leave a comment
Your Email Address Will Not Be Published.
Related articles

Home
Trive
TriveHub

TriveHub, where financial empowerment begins.
Explore our comprehensive financial education platform, where market insights, expert guidance, and premium content come together to shape your investment journey. Whether it's stocks, currencies, or cryptocurrencies that pique your interest, we provide the knowledge you need to make informed decisions.
All financial products traded on margin carry a high degree of risk to your capital. They are not suited to all investors, and you can lose more than your initial deposit. Please ensure that you fully understand the risks involved and seek independent advice if necessary. For further information, please see our full Risk Disclosure, Terms of Business, and Privacy Policy.
We use cookies to support features like login and allow trusted media partners to analyze aggregated site usage. Keep cookies enabled to enjoy the full site experience. By browsing our site with cookies enabled, you are agreeing to their use. Review our cookie information for more details.
This website (trivehub.com) belongs to Trive International, and it is the registered trademark of Trive International Ltd. Trive International Ltd. is authorized and regulated by the British Virgin Islands’ financial authority, named Financial Services Commission (“FSC BVI"), under the company number 1728826 and license number BVI SIBA/L/14/1066.
0 comments